California Schools
Real California education data, from K-12 census to UC admissions.
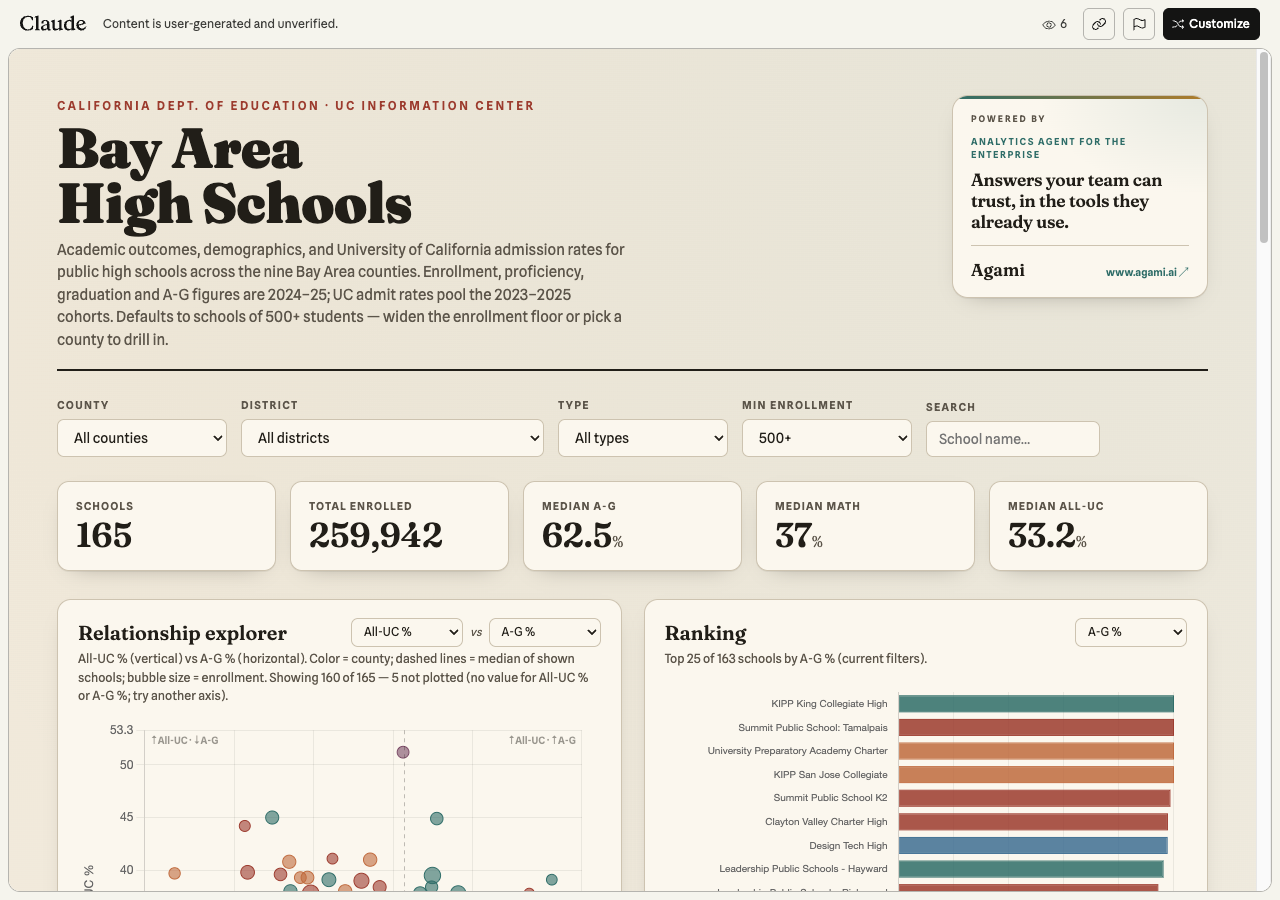
California Schools is our live public demo. Every number is real and publicly sourced, so you can check the agent against the state’s own published figures.
It joins two datasets that usually live apart: the CDE’s K-12 schools, enrollment, and meal-eligibility data, and UC’s freshman admissions by feeder high school. They share a CDS code, so you can ask which schools send the most students to a UC campus, then ask what poverty looks like at those same schools, one question across two government sources, and across two databases (Postgres and BigQuery) at once.
The semantic model behind it encodes the data’s quirks (active-status filters, per-campus rows that must not be summed), so the agent inherits the caveats instead of you having to remember them.
See what a few questions can build
Built from this data with Claude. Open it to explore.
Things you can ask
Ask these verbatim, or use them as a starting point.
“Which California high schools sent the most students to UC Berkeley?”
Bridges K-12 schools to UC admissions on the shared CDS code, two public datasets joined as one.
“Which high schools send the most students to UC Berkeley relative to their size?”
Divides Berkeley admits by enrollment, so smaller schools that punch above their weight beat the biggest ones.
“Which high-poverty high schools still send a lot of students to UC?”
Pairs meal-eligibility (a poverty proxy) with UC admits to surface schools beating the odds.
“How has the ethnic mix of UC Berkeley admits from California public high schools changed since 1994?”
A thirty-year view of who gets into UC Berkeley from California's public schools.
“Which counties send the most students to UC relative to their K-12 enrollment?”
Compares counties per-student, not by raw count, so small overperformers surface.
“Which large school districts have the highest share of English learners?”
Ranks by English-learner share, not headcount, so Santa Ana and Oakland top giant LA Unified.
What's inside
K-12 (CDE)
Every public school, census-day enrollment by race, gender, and English-learner status, and meal-eligibility (a poverty proxy), for 2024-25. Joined on the 14-digit CDS code.
UC admissions
UC freshman applications, admits, and enrollees by source high school, all 9 campuses, fall 1994 to 2025, broken out by ethnicity.
Get started
Two steps to your first answer.
- 1
Add the Agami MCP server to the AI tool you already use.
See detailed connection guides →MCP server URLhttps://public.agami.ai/mcp - 2
Click Connect, sign in with Google or Microsoft, and ask away in plain English.
How the data was built
Every number traces back to a public source and is reconciled against the publisher's own official totals before it goes into the demo. It is the same modeling and validation discipline Agami brings to your own data. Spotted a number that looks wrong? Email us at contact@agami.ai and we'll look into it.